


cPanel offers a robust suite of functionalities, among the most valuable of which is its ability to help you monitor the resources consumed by your websites. Diligently tracking your resource usage is crucial for maintaining optimal website performance, preventing potential overloads, and managing your hosting plan more efficiently. Understanding these metrics empowers you to make informed decisions about your hosting environment and ensure a smooth online experience for your visitors.
Accessing Resource Usage Metrics in cPanel
To begin monitoring your resource usage, first, access your cPanel account. Once logged in, you will typically find the Statistics sidebar located on the right side of your screen.
Understanding the Statistics Overview
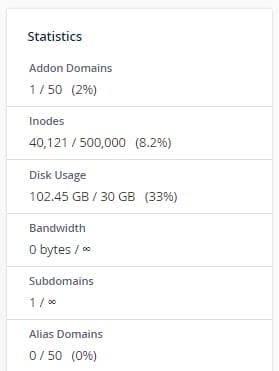
The Statistics section provides a high-level overview of various general metrics related to your hosting account. This initial glance offers insights into your current resource consumption, including disk usage, email accounts, and inode count. Below is a detailed explanation of the key metrics displayed in this section:
- Addon Domains – This indicates the total number of additional domains configured and hosted within your current hosting plan.
- Inodes – Represents the total count of all files and directories stored on your hosting plan. For example, a single email message counts as one inode, while an email with two attachments would count as three inodes (one for the email and one for each attachment). Monitoring inodes is important as hosting plans often have limits.
- Disk Usage – Shows the amount of storage space currently utilized by your website files, databases, emails, and other processes on your hosting account. Keeping an eye on this helps prevent exceeding your allocated storage.
- Bandwidth – This metric tracks the monthly data transfer, or the amount of data sent and received by your hosting plan. High bandwidth usage can indicate significant website traffic or large data transfers.
- Subdomains – Displays the number of subdomains you have created under your primary domain.
- Email Accounts – Indicates the total number of email accounts that have been set up and are active within your cPanel.
- Autoresponders – Shows the quantity of automatic reply messages configured for your email accounts, which are useful for sending immediate replies to incoming emails.
- Forwarders – Reflects the number of email forwarders established in your email accounts, used to redirect incoming emails to another address.
- Email Filters – Displays the number of email filters you have set up to manage incoming mail, along with any associated limits.
- FTP Accounts – This lists the number of File Transfer Protocol (FTP) accounts created, which are used to upload and manage your website files.
- MySQL Databases – Indicates the number of databases you currently host and often shows the maximum limit allowed. This metric is particularly critical as databases directly influence your website's performance and disk space consumption.
- CPU Usage – Represents the percentage of CPU power being consumed by your hosting plan. Consistent high CPU usage can lead to slower website performance.
- Entry Processes – Shows the number of concurrent PHP processes actively executing to handle incoming requests to your website. A high number here might suggest a need for optimization or a more powerful hosting plan.
- Physical Memory Usage – Displays the amount of physical memory (RAM) currently being used by your hosting services.
- IOPS – (Input/Output Operations Per Second) This measures how much data is read from and written to your disk storage per second. It's an important indicator of disk activity.
- I/O Usage – Represents the total amount of input and output operations performed by your hosting plan.
- Number of Processes – Shows the count of all currently running processes associated with your hosting account.
Detailed Resource Usage Analysis
For a more in-depth analysis and graphical representation of your resource consumption, navigate to the Resource Usage section within cPanel.

Once inside the Resource Usage section, click on the Current usage tab. Here, you will find detailed information about your hosting plan's resource utilization presented in an easy-to-understand graphic format.
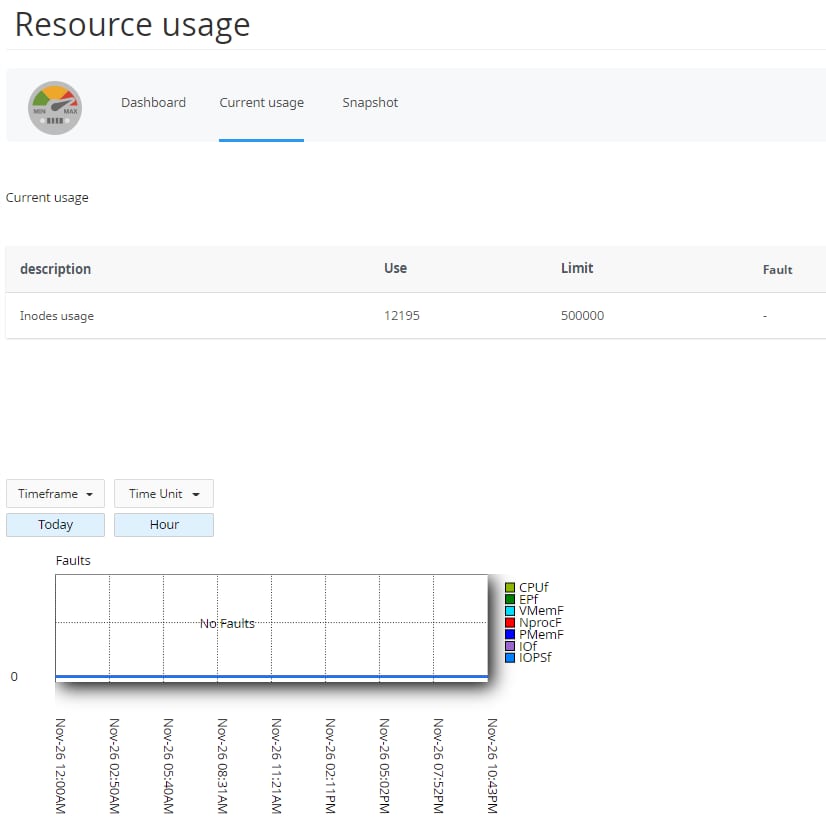
Interpreting the Faults Graph
The Faults graph within the Resource Usage section provides critical insights into potential performance bottlenecks. It specifically highlights instances where resource limits might have been hit. Key concepts represented in this graph include:
- CPUf (CPU Faults) – Indicates instances where the average CPU usage exceeded its allocated limits, potentially leading to performance degradation.
- EPf (Entry Process Faults) – Shows occurrences where the number of concurrent web server requests (entry processes) reached its maximum allowance, meaning new requests could not be immediately processed.
- VMemF (Virtual Memory Faults) – Represents situations where processes attempted to allocate more virtual memory than permitted, which can impact stability.
- NprocF (New Process Faults) – Signals issues related to the creation of new processes, often indicating a reached limit on the total number of processes allowed.
- PMemF (Physical Memory Faults) – Denotes memory failures, specifically when processes consume an excessive amount of physical memory, preventing new client requests from being served efficiently.
- IOf (I/O Faults) – Highlights instances where data read/write operations took longer than the allotted time, indicating potential disk I/O bottlenecks.
- IOPSf (IOPS Faults) – Signifies situations where the number of input/output operations per second exceeded the allowed threshold, leading to performance issues related to disk access.
By regularly monitoring these detailed metrics and understanding what each one represents, you can proactively identify and address potential resource limitations or performance issues on your hosting plan. This practice is essential for maintaining a healthy and responsive website.
