


Understanding and monitoring your website's resource usage is crucial for maintaining optimal performance and stability. Websites rely on various server resources, such as CPU, memory, and disk space, to function efficiently. Keeping track of these metrics can help you identify potential bottlenecks, troubleshoot issues, and ensure your site runs smoothly. This comprehensive guide will walk you through the straightforward process of checking these vital statistics within your cPanel account.
Accessing Your cPanel Dashboard
The first step in checking your website's resource usage is to log in to your cPanel account. This is typically done through a URL provided by your hosting provider, often ending in :2083 or /cpanel. Once you have successfully entered your credentials, you will be directed to your cPanel dashboard, which serves as the central control panel for your website's hosting environment.
Overview of Current Resource Usage
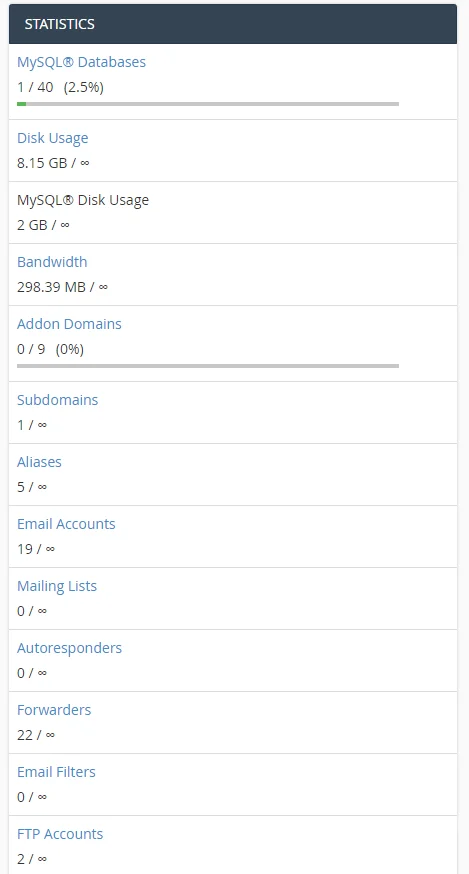
Upon successful login to your cPanel dashboard, you'll typically find a summary of your current server resource usage prominently displayed on the right-hand sidebar. This section provides a quick, at-a-glance overview of your website's immediate performance metrics, allowing you to see if your site is currently operating within its allocated limits.
Detailed Resource Usage History
For a more detailed historical perspective of your resource consumption, navigate to the "Metrics" section within your cPanel interface. Here, you will find and click on either "CPU and Concurrent Connection Usage" or "Resource Usage". This dedicated section is invaluable for identifying patterns, understanding long-term performance trends, and diagnosing past performance issues.
This action will direct you to the Resource Usage Overview page. Should your website have encountered any significant resource limitations, they will be highlighted on this page, often indicating a need for optimization or a plan upgrade. If no immediate issues are presented, you can proceed by clicking the 'Details' button to access comprehensive resource usage information, including graphs and tables.
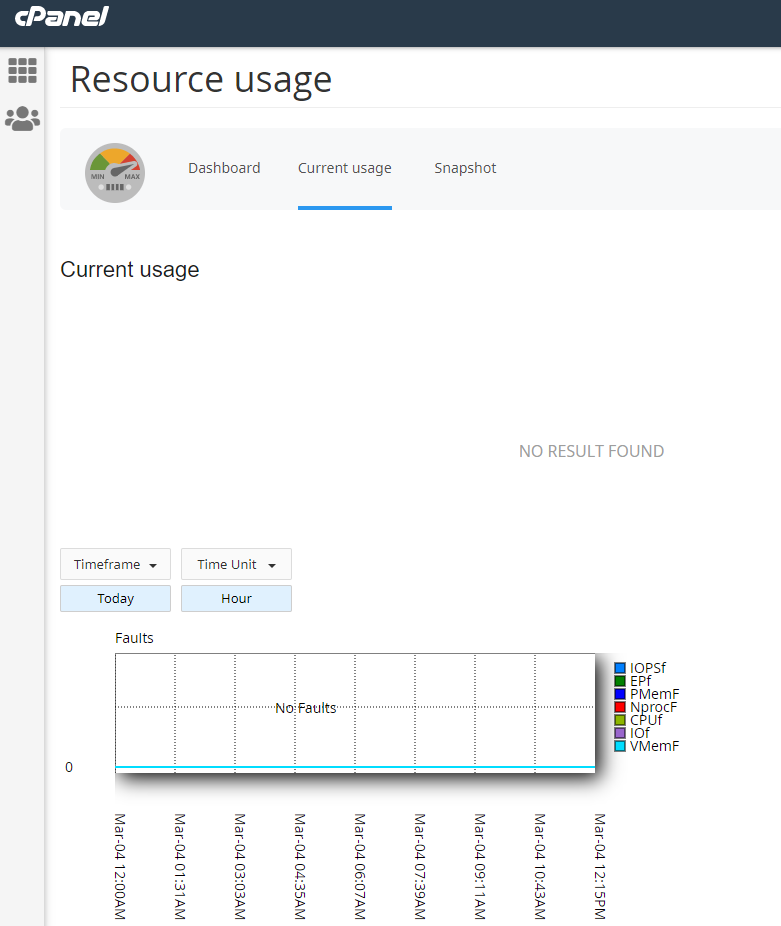
After clicking 'Details', a graphical representation of your website's resource consumption over time will appear. You have the flexibility to select a specific timeframe to analyze, such as the last 24 hours, week, or month, providing valuable insights into usage trends. Below the graph, a detailed table presents precise usage statistics for various metrics, offering a numerical breakdown of your resource consumption.
How to Analyze Disk Usage
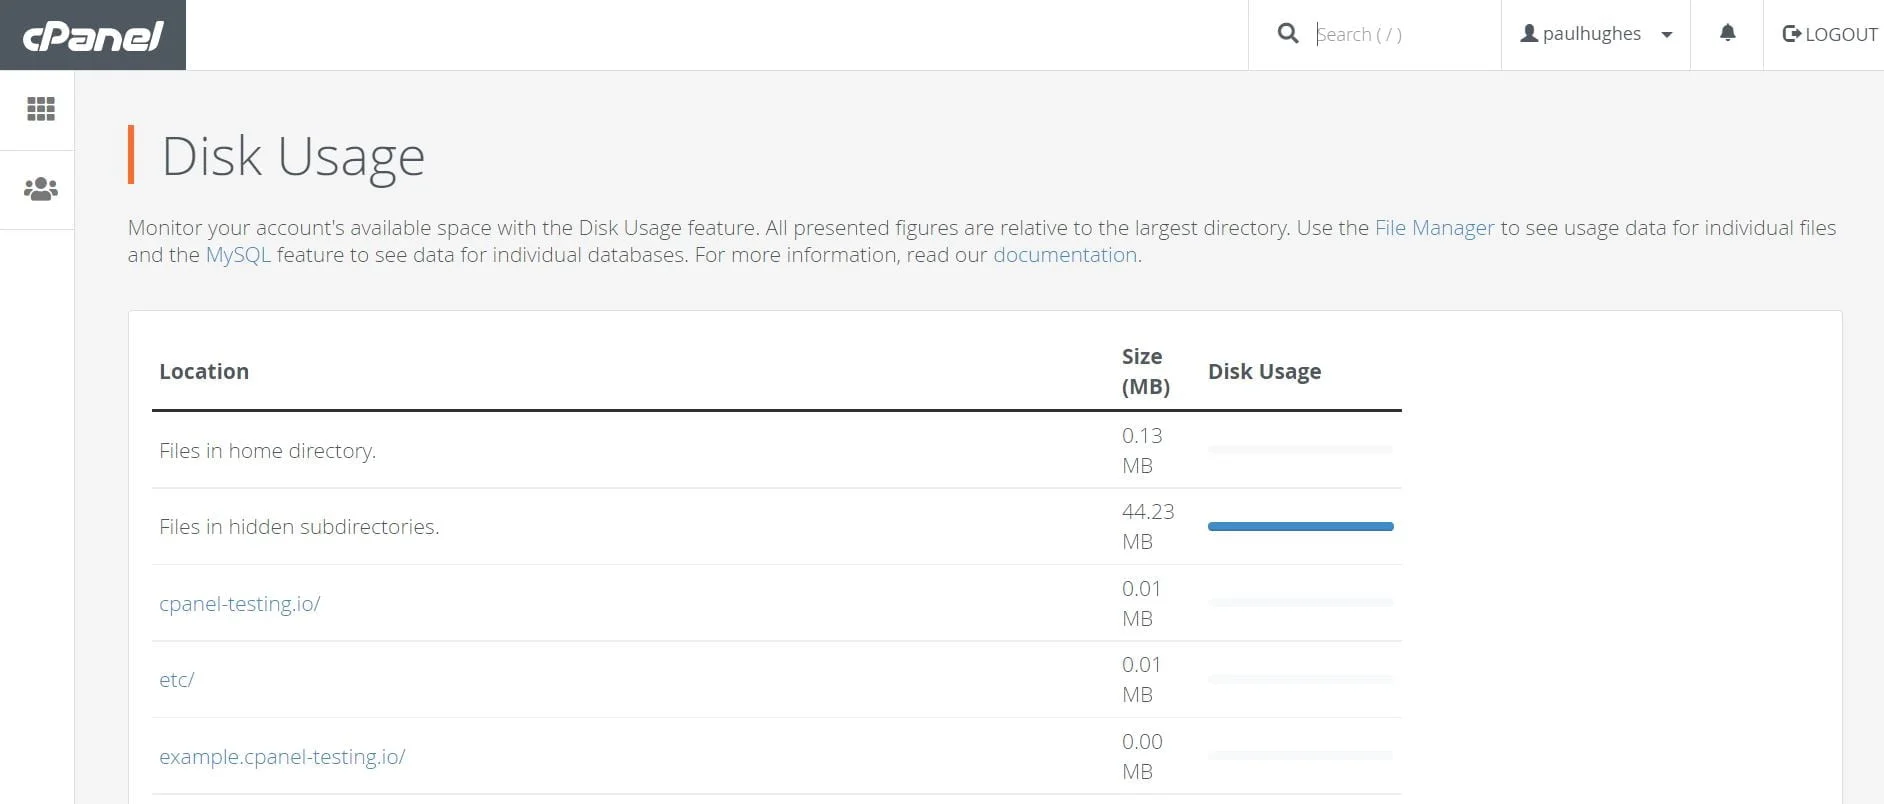
Beyond CPU and memory, understanding your disk space consumption is equally important. Websites accumulate files over time, including backups, media, emails, and application data, which can quickly consume available storage. To analyze your disk usage, simply navigate to the 'Disk Usage' icon located within your cPanel dashboard. This tool provides a clear breakdown of where your storage is being utilized across different directories and files.
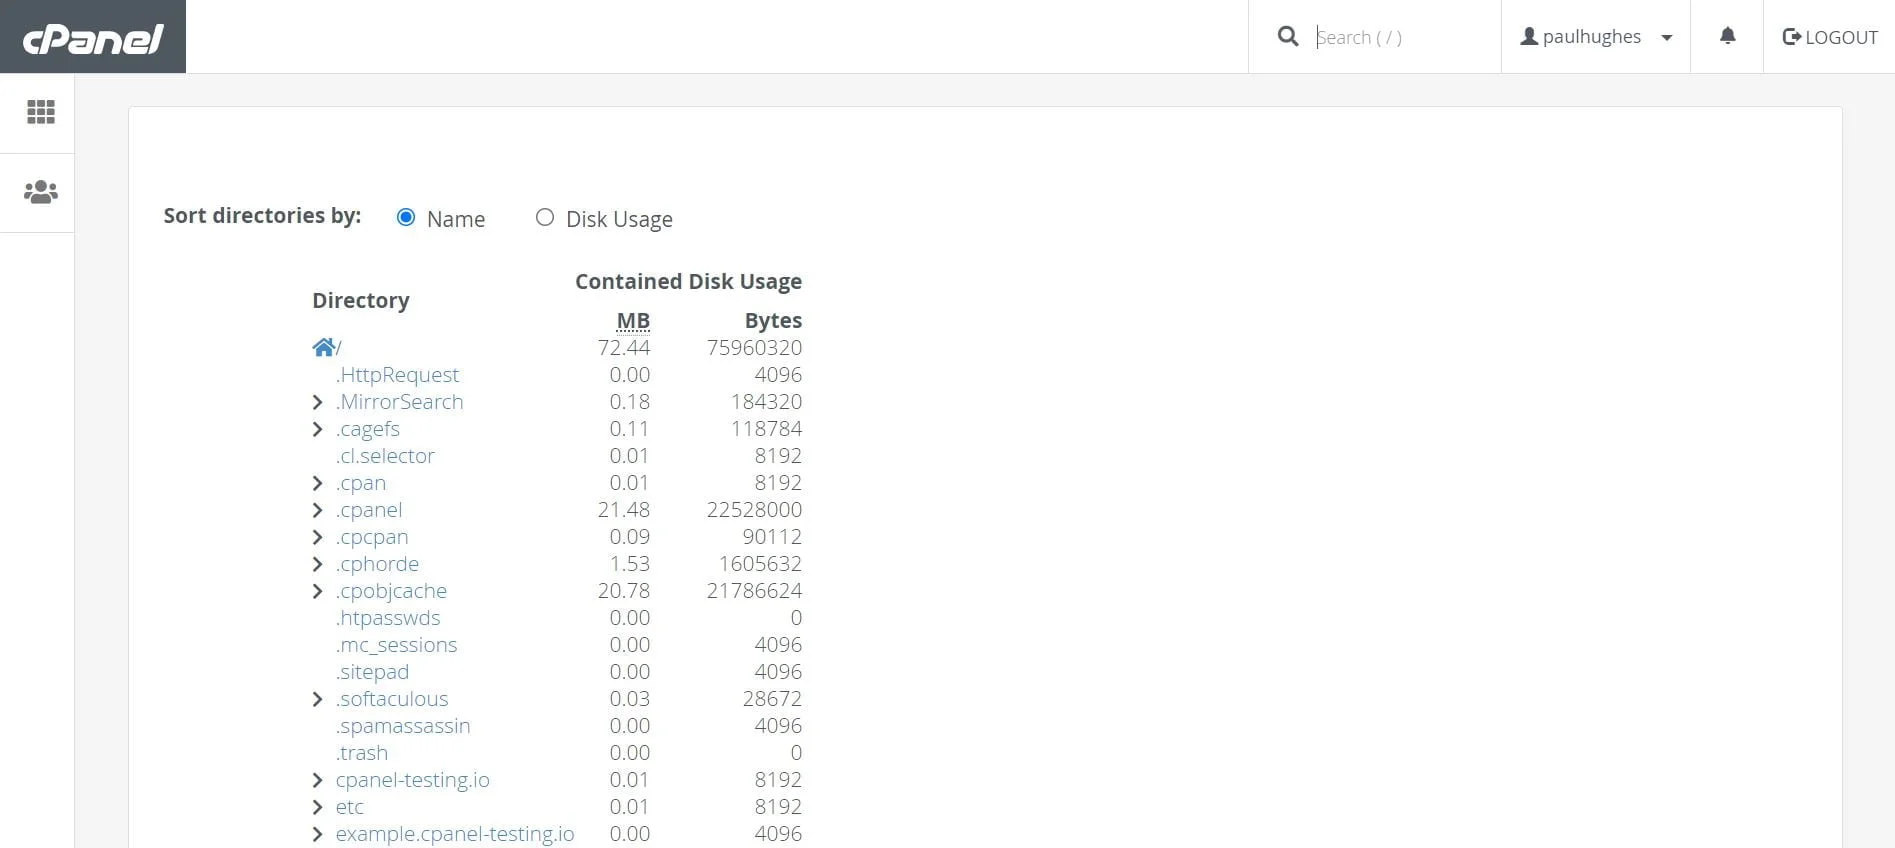
The disk usage interface allows you to sort directories by name or, more critically, by the amount of disk space they consume. This functionality is extremely helpful in identifying large files or directories that might be consuming excessive storage, enabling you to manage your space more effectively by deleting unnecessary data or optimizing existing files.
Understanding Resource Metrics: A Legend
To fully interpret the resource usage graphs and tables, it's essential to understand the various metrics displayed. Each metric provides specific information about how your website is interacting with the server's resources. Below is a legend explaining common terms you'll encounter when reviewing your cPanel resource usage:
- Average/a: Represents the average resource usage recorded over the selected period. This provides a general sense of your site's typical consumption.
- Limit/l: Indicates the maximum resource allocation set for your hosting account. Exceeding this limit can lead to temporary service interruptions, slower website loading times, or even account suspension by your hosting provider.
- Max/m: Shows the peak resource usage recorded during the selected interval. High 'Max' values, even if 'Average' is low, can point to occasional resource spikes that might need investigation.
- F (Failure): Signifies instances where resource limits were hit, potentially causing slowdowns or temporary service interruptions. This is a critical indicator that your site is struggling with its current resource allocation.
- CPU (Central Processing Unit): Refers to the processing power utilized by your website. High CPU usage can indicate intensive scripts, inefficient code, or a sudden surge in website traffic.
- vMEM/vM (Virtual Memory): The total amount of memory that a process can use, including both physical RAM and swap space. It's a measure of the total addressable memory space.
- pMEM/pM (Physical Memory): The actual RAM actively used by your website processes. Exceeding this often leads to 'out of memory' errors, forcing processes to terminate or swap space to be heavily used.
- EP (Entry Processes): The number of concurrent PHP processes your account can handle. A high number of simultaneous requests from visitors can quickly exhaust this limit, leading to visitors waiting or seeing errors.
- nPROC/nP (Number of Processes): The total number of processes running under your cPanel account. This includes all active scripts, tasks, and background operations initiated by your website.
- IO (Input/Output): Measures the rate at which your website reads and writes data to and from the disk. High I/O can be caused by frequent database queries, heavy file uploads/downloads, or intensive caching operations.
Conclusion
Regularly monitoring your website's resource usage in cPanel is a proactive approach to maintaining a healthy and high-performing online presence. By understanding these metrics, you can identify potential issues before they impact your visitors, optimize your website's performance, and make informed decisions about your hosting plan. This practice ensures your website remains fast, reliable, and accessible to your audience.
