Understanding how your server resources are utilized is crucial for maintaining optimal performance and identifying potential issues. Plesk Obsidian provides a comprehensive set of tools and statistical data, accessible directly from its intuitive interface, to help you monitor various aspects such as memory consumption, CPU usage, and network traffic.
Understanding Current Server Resource Usage
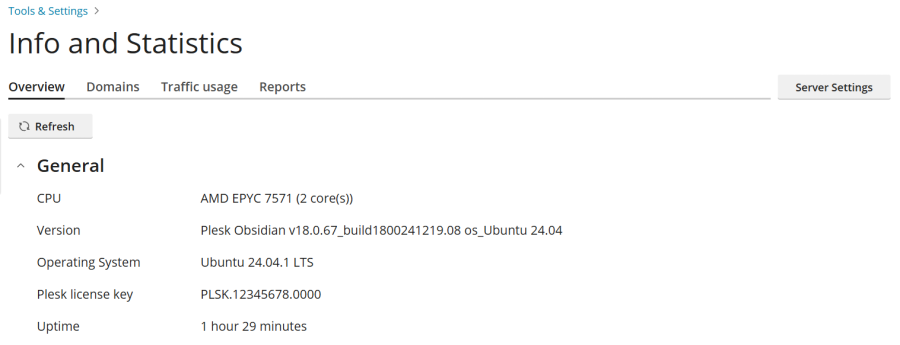
To gain insights into the current consumption of CPU, RAM, swap space, and disk space on your server, navigate to the “Info and Statistics” page within Plesk. This page also presents a breakdown of the domains hosted on your server, categorizing them as “active” (online), “problems” (online but exceeding resource limits like disk space or bandwidth), and “inactive” (offline due to suspension). This overview helps administrators quickly assess the overall health and status of their hosted websites.
To view the current server resource usage:
- Log in to Plesk.
- Proceed to Tools & Settings, then select Info and Statistics (found under the “Server Management” section).
- (Optional) Click the Refresh button to ensure you are viewing the most up-to-date information. While the page automatically loads the latest data upon opening, refreshing is beneficial if you have kept the page open for an extended period or are actively monitoring real-time changes in server resource usage.
Analyzing Disk Space and Traffic Consumption
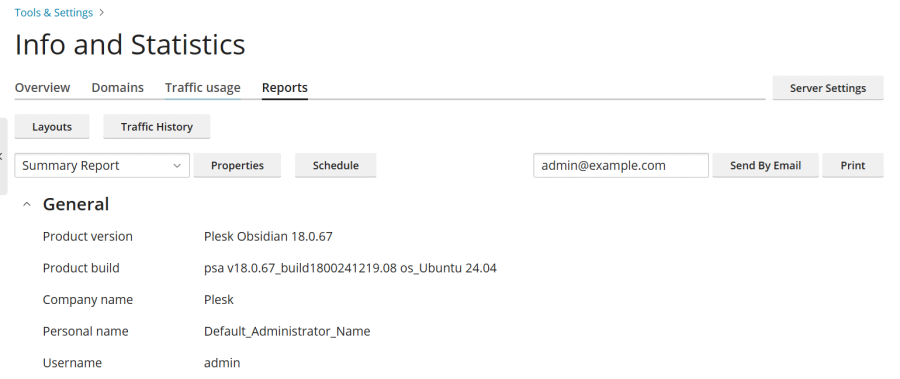
The “Reports” tab on the “Info and Statistics” page offers a detailed overview of disk space and traffic usage across all domains hosted on the server, alongside statistics on the number of active and inactive resellers and customers. This section is invaluable for tracking resource allocation and identifying trends in server usage over time.
To review disk space and traffic usage:
- Log in to Plesk.
- Navigate to Tools & Settings > Info and Statistics (under “Server Management”).
- Select the “Reports” tab.
- (Optional) To view a different report, choose the desired report template from the available drop-down menu.
Reports are dynamically generated based on templates, which dictate the level of detail and specific metrics included. Plesk provides two default report templates: “Summary” and “Full”. Furthermore, you have the flexibility to create, remove, and fully customize these report templates to suit your specific monitoring requirements.
Customizing Report Templates
To tailor an existing report template to your needs:
- Log in to Plesk.
- Go to Tools & Settings > Info and Statistics (under “Server Management”).
- On the “Reports” tab, select the report you wish to customize from the drop-down menu.
- Click Properties, make your desired modifications, and then click Save.
Creating New Report Templates
To establish a new, custom report template:
- Log in to Plesk.
- Navigate to Tools & Settings > Info and Statistics (under “Server Management”).
- On the “Reports” tab, click Layouts, and then click the
 icon.
icon. - Provide a name for your new report template, configure its customization options, and click Save.
Removing Report Templates
If a report template is no longer needed, you can easily remove it:
- Log in to Plesk.
- Go to Tools & Settings > Info and Statistics (under “Server Management”).
- On the “Reports” tab, click Layouts.
- Select the checkbox next to the report template you wish to remove, click Remove, and then confirm by clicking Yes, remove.
For convenience and record-keeping, reports can be printed or sent via email. Additionally, Plesk allows you to configure automated report delivery, ensuring you receive critical insights regularly without manual intervention.
Printing a Report
To obtain a physical copy of a report:
- Log in to Plesk.
- Go to Tools & Settings > Info and Statistics (under “Server Management”).
- Select the “Reports” tab.
- (Optional) To print a specific report, choose the desired report template from the drop-down menu.
- Click Print. The report will open in a new browser window, pre-formatted for printing.
- Utilize your browser’s print function (usually **File** > **Print**) to complete the action.
Sending a Report by Email
To distribute a report electronically:
- Log in to Plesk.
- Go to Tools & Settings > Info and Statistics (under “Server Management”).
- Select the “Reports” tab.
- (Optional) To send a different report, select the desired report template from the drop-down menu.
- (Optional) Enter the recipient’s email address. By default, the administrator’s email address is pre-filled.
- Click Send By Email.
Scheduling Automatic Report Delivery
To set up recurring, automated delivery of reports via email:
- Log in to Plesk.
- Go to Tools & Settings > Info and Statistics (under “Server Management”).
- Select the “Reports” tab.
- (Optional) To schedule a particular report for regular delivery, select the desired report template from the drop-down menu.
- Click Schedule, and then click Add Schedule.
- Ensure the “Enable” checkbox is selected.
- Under “Deliver frequency”, specify whether you wish to receive the report daily, weekly, or monthly.
- Under “Deliver to”, enter the desired email address. The administrator’s email address is used by default.
Beyond reports, this section also allows you to review the total traffic consumed on the server during any specific month, providing a high-level overview of network usage.
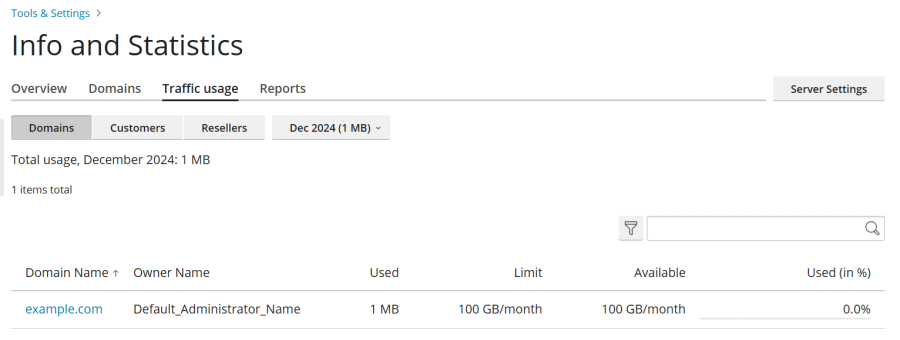
Viewing Monthly Traffic Usage
To inspect the server’s traffic usage for a particular month:
- Log in to Plesk.
- Go to Tools & Settings > Info and Statistics (under “Server Management”).
- Select the “Traffic usage” tab, then choose the desired month from the drop-down menu.
Monitoring Traffic Usage by Domains, Customers, and Resellers
For a granular understanding of network resource consumption, the “Traffic usage” tab on the “Info and Statistics” page provides detailed insights into how much traffic has been used by individual domains, customers, or resellers during a specific month. This allows for precise monitoring and accountability of resource allocation.
To access traffic usage statistics broken down by domains, customers, or resellers:
- Log in to Plesk.
- Go to Tools & Settings > Info and Statistics (under “Server Management”).
- Navigate to the “Traffic usage” tab, and then select the relevant month from the drop-down menu.
- To view traffic usage specifically by individual customers, click the Customers button. Similarly, for a breakdown by resellers, click Resellers.