


Effective server resource monitoring is crucial for maintaining optimal performance and stability of your Plesk environment. Plesk Monitoring, previously known as Advanced Monitoring, provides robust tools to track server resource utilization and promptly alert you when predefined thresholds are exceeded. This comprehensive guide will walk you through the process of tracking server resource usage using Monitoring and configuring essential notification settings to ensure your Plesk installation operates without interruption.
Monitoring is a core feature of Plesk Obsidian, installed by default, and offers two distinct operational modes. Upon your initial access to the Monitoring section, you will be prompted to select and activate your preferred mode:
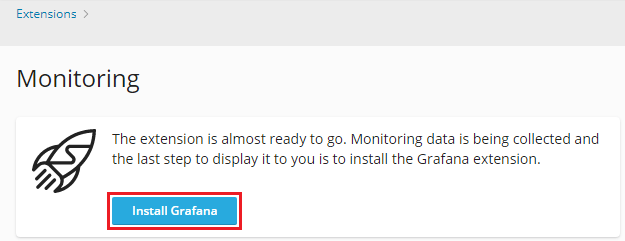
- Built-in Monitoring: Referred to simply as “Monitoring” within Plesk, this mode operates in conjunction with the Grafana extension. Grafana is utilized to visualize server metrics through intuitive graphs. If you opt for Built-in Monitoring, Plesk will guide you through the installation of the necessary Grafana extension.
Note: The features and configurations discussed in the majority of this topic pertain specifically to Built-in Monitoring.
- 360 Monitoring: This is an innovative feature provided by the cloud service Plesk 360. 360 Monitoring integrates seamlessly with your Plesk installation, offering two comprehensive dashboards: an external dashboard within the Plesk 360 cloud service and an internal dashboard within your Plesk interface. Selecting 360 Monitoring will prompt you to connect your Plesk server to Plesk 360 and then activate the monitoring service.
Note: 360 Monitoring requires Plesk Obsidian version 18.0.36 or later to function correctly.
For administrators managing multiple servers or those requiring website availability monitoring, activating 360 Monitoring is highly recommended due to its expanded capabilities. To assist you in making an informed decision, a detailed comparison between Built-in Monitoring and 360 Monitoring is provided in the Differences Between Built-in Monitoring and 360 Monitoring section of this article.
Note: You retain the flexibility to switch between these two monitoring modes at any time, allowing you to adapt your monitoring strategy as your needs evolve.
Tracking Monitoring Graphs
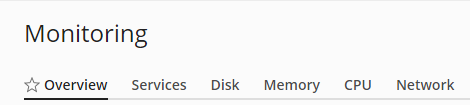
The Monitoring interface is conveniently located in the Navigation Pane of your Plesk control panel. Monitored resources and services are logically organized into five distinct categories, each accessible via its dedicated tab.
By default, the “Overview” tab presents a selection of graphs displaying the most critical server parameters. However, you have the flexibility to customize this tab to feature the metrics most relevant to your operational needs.
To personalize the “Overview” tab:
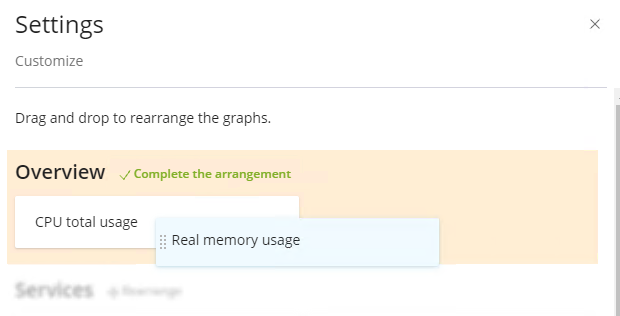
- Navigate to Monitoring and click on Settings, then select Customize.
- From here, you can choose the specific graphs you wish to display on the “Overview” tab and arrange their layout to your preference.
Note: Should you wish to revert to the default graph layout across all Monitoring tabs, simply click Restore defaults.
Once your customization of the “Overview” tab is complete, click OK to save your changes.It’s important to understand that the values displayed by Monitoring reflect resource usage at the moment the page was loaded, rather than in real-time. You can configure the frequency at which Monitoring automatically refreshes its data, with options ranging from every five seconds to hourly. Alternatively, you can disable auto-refresh and manually update the data by clicking the  icon. The default auto-refresh interval for Monitoring data is every two minutes.
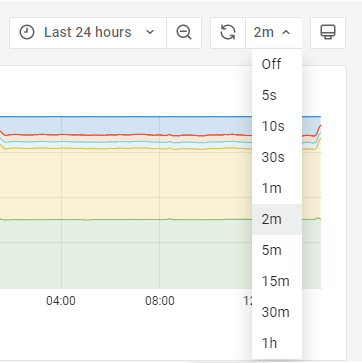
Note: Monitoring data is not updated in real time. Therefore, if your server experiences continuous high load, you may observe discrepancies between the data presented by Monitoring and that from a real-time system resource usage monitor (such as ‘top’ on Linux or Task Manager on Windows).
By default, all graphs across all Monitoring tabs display data generated over a 24-hour period. Adjusting this default time range can be highly beneficial for:
- Analyzing how various parameters fluctuate over extended periods.
- Identifying specific time ranges when resource usage peaks or minimizes, aiding in capacity planning and troubleshooting.
To modify the time range for which Monitoring graphs display data:
- Access Monitoring and select the tab for which you intend to change the time range.
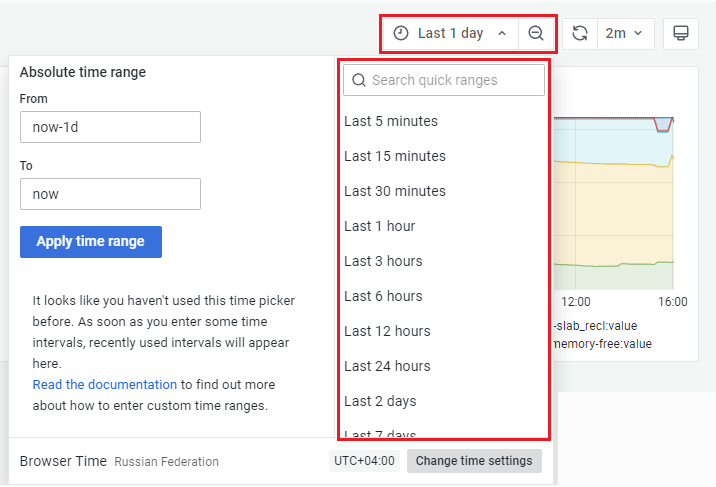
- Next to the
 icon, click on the displayed time period, which is "Last 1 day" by default.
 - Adjust the time range using one of the following methods:
- Selecting a predefined time range: Choose from options like “Last 5 minutes”, “Last 1 hour”, or other predetermined intervals.
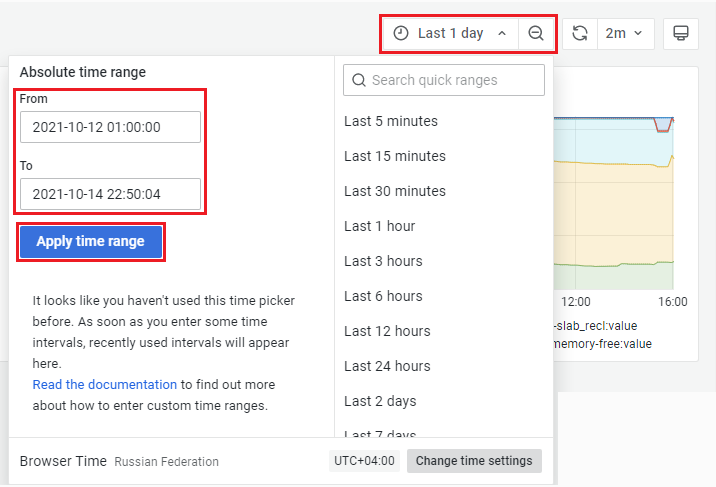
- Specifying a custom time range: Define a precise start and end date and time, for example, from October 12, 2021, 01:00:00 to October 14, 2021, 22:50:04. To do this, locate the “Absolute time range” section, input your desired dates and times in the “From” and “To” fields, and then click Apply time range. For more detailed instructions on custom time range specifications, refer to the Grafana documentation on time range controls.
- Selecting a predefined time range: Choose from options like “Last 5 minutes”, “Last 1 hour”, or other predetermined intervals.
Note: Monitoring does not permanently save any modifications you make to its graph settings. For instance, if you select the “Last 6 hours” time range and disable auto-refresh, the Monitoring interface will revert to its default graph settings once your browser page is refreshed.
Tracking Monitoring Notifications
Beyond visual graph analysis, monitoring server health is significantly enhanced through the proactive use of Monitoring notifications and alerts. These alerts provide timely information about critical changes in your server's state.
Monitoring generates notifications directly within the Plesk interface when a resource's usage surpasses its predefined threshold, or when it returns to its normal operational value. This ensures you are informed of both potential issues and their resolution.
Notifications are only displayed for resources that have been explicitly enabled and for which specific thresholds have been configured in the Monitoring settings.
Certain critical resources come with their notifications already enabled and default thresholds pre-set. When resource usage exceeds these default thresholds, it indicates that the resource is nearing its critical capacity, and this elevated load could potentially lead to performance problems or service interruptions.
For users who are not experienced in server administration, it is generally recommended to maintain the default Monitoring configuration. The preconfigured thresholds and enabled notifications are optimized for most environments. However, advanced users can customize these settings by defining their own thresholds and enabling or disabling notifications for specific resources as needed.
To configure custom thresholds or manage notifications for individual resources:
- Access Monitoring and click on Settings.
- Within this section, you have the following options:
- Enable or disable notifications for particular resources.
- Customize thresholds for enabled resources. If a resource's notification is off, you must enable it first before you can set its threshold. Some resources may offer two types of thresholds: an absolute value (in units of measurement) and a relative value (in percentage). In such cases, select your preferred threshold type before specifying its value.
- Click Apply to save your customized settings.
You also have the option to globally disable all Monitoring notifications across all resources if required.
To disable all notifications from Monitoring:
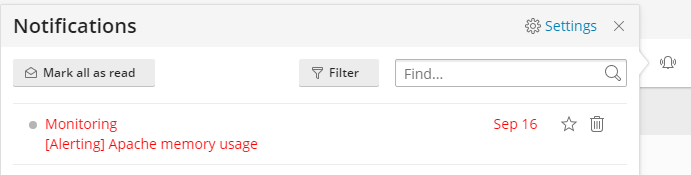
- In the upper right corner of the screen, click the
 icon, then click "Settings" adjacent to the
  icon.
icon. - From the notification settings panel, you can enable or disable specific categories of Monitoring notifications:
- Notifications when the resource usage value returns to normal.
- Notifications when the resource usage threshold has been exceeded.
- Notifications when the Monitoring agent detects an issue.
Updating Monitoring After the Hardware Change
During its initial installation, Monitoring diligently records the hardware configuration of your Plesk server. Subsequently, Monitoring conducts an automatic daily check for any modifications to the server's hardware. This ensures its data remains accurate and relevant.
If you have recently updated your server hardware and prefer not to wait for the automatic daily detection, you can manually prompt Monitoring to reflect these changes immediately.
To manually update Monitoring after a hardware change:
- Go to Monitoring and click on Settings.
- Click Detect Hardware Changes to initiate an immediate scan for updated hardware configurations.
Differences Between Built-in Monitoring and 360 Monitoring
The table below provides a clear comparison of the key features and characteristics between the two Monitoring modes: Built-in Monitoring and 360 Monitoring, helping you choose the best solution for your needs.
| Service/Parameter | Built-in Monitoring | 360 Monitoring |
|---|---|---|
| Delivered | Internally by the Plesk extensions. | Externally by the remote cloud service Plesk 360. |
| Works if Plesk is down | No. | Yes. |
| Number of servers it can monitor | One Plesk server. | Multiple servers. |
| Can monitor servers without Plesk installed | No, does not exist without Plesk. | Yes. |
| Monitors website availability | No. | Yes. |
| Dashboards | One in Plesk. | The internal one in Plesk and the external one in Plesk 360. The external dashboard in Plesk 360 shows data from all servers and websites you monitor in one place. |
| Notifications and thresholds | Yes. | Yes. |
| Sends notifications to | Your email address. | Multiple communication channels: your email address, cellphone (via SMS), other devices (via Pushbullet and/or Pushover), Slack, and so on. |
| Price and licensing | Free, no license. |
|
(Plesk for Linux) Limiting the Number of Websites 360 Monitoring Monitors per Server
360 Monitoring offers the capability to monitor numerous websites across an array of servers. The precise number of websites and servers you can monitor is determined by your specific license type, along with any additional website or server capacity you may have purchased.
By default, the 360 Monitoring license does not impose a limit on the number of websites that can be monitored per individual server. For instance, if your license permits monitoring a total of 20 websites across 4 servers, you could potentially monitor all 20 websites on a single server, or distribute them as 5 websites per server across all four. In both scenarios, the overall license limit of 20 websites would be utilized.
For hosting providers who offer 360 Monitoring services to their customers, it can be beneficial to implement a limit on the number of websites monitored per server. This measure helps prevent a situation where one or a few customers' servers consume the entirety of the license's website monitoring capacity.
To implement a limit on the number of websites 360 Monitoring monitors per server:
- Open the panel.ini file for editing. This file is typically located at
/usr/local/psa/admin/conf/panel.ini. You can also utilize the Panel.ini Editor extension available within the Plesk interface for this purpose. - Add the following lines to the
panel.inifile, replacing<the desired website limit>with your chosen numerical value, and then save the file:[ext-monitoring] cloudMaxWebsites = <the desired website limit>For example, if you set
cloudMaxWebsites = 5, 360 Monitoring will not monitor more than 5 websites per server, regardless of whether the overall license limit has been reached.
Note: Customers with appropriate permissions (e.g., SSH access to the server or the ability to use the Panel.ini Editor extension) may be able to remove or alter this website limit. To ensure your changes in panel.ini are preserved and not overridden by customers, it is advisable to forbid root SSH access to the Plesk server and to blacklist the Panel.ini Editor extension.
(Plesk for Linux) Hiding the 360 Monitoring License Panel From Customers
360 Monitoring includes a dedicated panel that displays essential license information, such as the license type and its current limits for the number of servers and websites that you and your customers can monitor. By default, this license panel is visible within the Plesk interface.
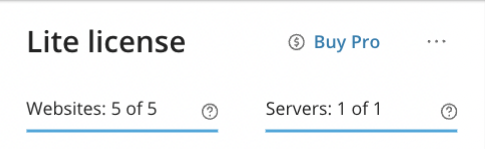
As a hosting provider selling 360 Monitoring to your customers, you might prefer to conceal this license panel from them. Since customers typically do not manage license limits, this information may not be relevant to their operational tasks and could lead to unnecessary confusion.
To hide the 360 Monitoring license panel from your customers:
- Access the panel.ini file for editing. This file is typically located at
/usr/local/psa/admin/conf/panel.ini. Alternatively, you can use the Panel.ini Editor extension available through the Plesk interface. - Add the following lines to the
panel.inifile and then save your changes:[ext-monitoring] cloudShowLicensePanel = false
Note: Similar to website limits, customers who have the capability to edit the panel.ini file (either via the Panel.ini Editor extension or through SSH access to the server) could potentially revert this change and make the license panel visible again. To maintain the hidden status of the license panel, it is recommended to restrict root SSH access to the Plesk server and to blacklist the Panel.ini Editor extension.
